The Atlantic
America’s Poverty Problem Hasn’t Changed
The only thing that has is one of the ways the Census Bureau chooses to measure it.
When the Census Bureau released its latest data on income and poverty for the country, and despite a falling unemployment rate and a rising GDP—two promising macroeconomic signs—things haven’t improved all that much for American families in the past year.
n 2014, median household income was reported as $53,657—statistically the same as it was in 2013. The same stagnation held when it came to the poverty rate, with about 14.9 percent of Americans, or almost 47 million people, falling below the poverty threshold of about $24,000 for the year.
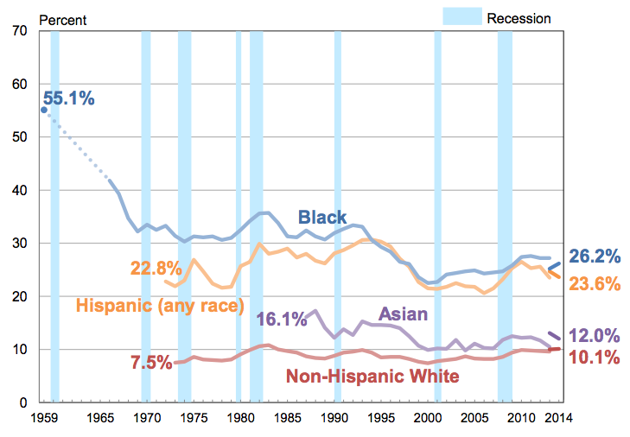
The news was, of course, worse for minorities and women. The rate of poverty among blacks and Hispanics was well over 20 percent. Women, too, remained more likely to struggle to make ends meet, especially elderly women, whose poverty rate was nearly double that of men in the 75 and older age group. And though more women than ever are participating in the workforce, with 61 percent of women employed full time in 2014, their earnings remained about 79 percent of their male colleagues.
Poverty Rate by Race
None of this is especially revelatory—America’s poverty problem is basically the same. So the biggest news in the data dump was the shifting methodology behind it all. For years, critics have said that the means of measuring poverty in the U.S. is overly simplistic. It includes forms of income such as social security and unemployment, but excludes other things that shape families’ finances, such as food stamps and tax credits. It also ignores that the price of some services, such as health care, have escalated more quickly than inflation has, and that the costs of childcare matters more to families than it did 50 years ago, when fewer women were working.
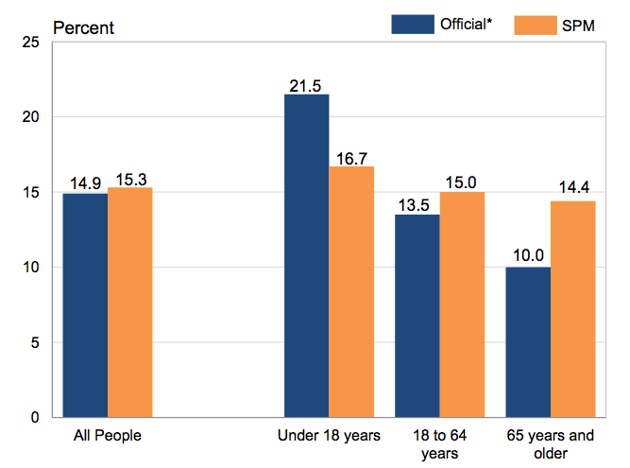
That’s why for the first time, the bureau released a supplemental poverty measure along with its official figures. According to the supplemental data, the poverty rate in the U.S. was about 15.3 percent—0.4 percentage points higher than the report’s official rate. But the additional measure shows differences in age groups. For instance, those under the age of 18 have a poverty rate of 16.7 percent—quite a bit lower than the 21.5 percent reported in the main findings. For older Americans, the tweaked metrics paint a grimmer picture, with the share of seniors living in poverty reported as nearly 5 percentage points higher than the official measure.
Poverty Rates: Official Versus Supplemental
The more inclusive measures might help monitor the effectiveness of programs meant to increase the well-being of specific populations, such as children or the elderly. Still, the use of an official, blanket income level remains a crude means of identifying families that are having a difficult time putting roofs over their heads or food on the table, especially considering the vast differences in cost of living around the country. To better understand the persistent poverty problem requires greater attention to nuanced and localized data that can better illustrate areas where the cost of essentials are outstripping income and benefits, and where families continue to suffer.
No comments:
Post a Comment