FAIR USE NOTICE

FAIR USE NOTICE

A BEAR MARKET ECONOMICS BLOG

DEDICATED TO OCCUPY AND THE ECONOMIC REVOLUTION

OCCUPY THE MARKETPLACE

FOLLOW ME ON FACEBOOK

This site may contain copyrighted material the use of which has not always been specifically authorized by the copyright owner. We are making such material available in an effort to advance understanding of environmental, political, human rights, economic, democracy, scientific, and social justice issues, etc. we believe this constitutes a ‘fair use’ of any such copyrighted material as provided for in section 107 of the US Copyright Law.

In accordance with Title 17 U.S.C. Section 107, the material on this site is distributed without profit to those who have expressed a prior interest in receiving the included information for research and educational purposes. For more information go to: http://www.law.cornell.edu/uscode/17/107.shtml

If you wish to use copyrighted material from this site for purposes of your own that go beyond ‘fair use’, you must obtain permission from the copyright owner.

FAIR USE NOTICE FAIR USE NOTICE: This page may contain copyrighted material the use of which has not been specifically authorized by the copyright owner. This website distributes this material without profit to those who have expressed a prior interest in receiving the included information for scientific, research and educational purposes. We believe this constitutes a fair use of any such copyrighted material as provided for in 17 U.S.C § 107.

Read more at: http://www.etupdates.com/fair-use-notice/#.UpzWQRL3l5M | ET. Updates
FAIR USE NOTICE FAIR USE NOTICE: This page may contain copyrighted material the use of which has not been specifically authorized by the copyright owner. This website distributes this material without profit to those who have expressed a prior interest in receiving the included information for scientific, research and educational purposes. We believe this constitutes a fair use of any such copyrighted material as provided for in 17 U.S.C § 107.

Read more at: http://www.etupdates.com/fair-use-notice/#.UpzWQRL3l5M | ET. Updates

All Blogs licensed under Creative Commons Attribution 3.0

Saturday, May 10, 2014

The Dow Jones Industrial Average is a Hoax


naked capitalism


Fearless commentary on finance, economics, politics, and power


The Dow Jones Industrial Average is a Hoax

Posted on May 10, 2014 by 
Yves here. On the occasion of an all-time high, a hard look at how the Dow Jones Industrial Average is constituted is in order.
By Wim Grommen, an elementary school teacher in mathematics and physics for eight years at secondary schools and later a trainer of programmers in Oracle software. He has also studied and written about transitions, social transformation processes, the S-curve and transitions in relation to market indices. His paper “The present crisis, a pattern: current problems associated with the end of the third industrial revolution” was accepted for an International Symposium in Valencia: “The Economic Crisis: Time for a paradigm shift, Towards a systems approach”
The Dow Jones Industrial Average (DJIA) Index is the only stock market index that covers both the second and the third industrial revolution. Calculating share indexes such as the Dow Jones Industrial Average and showing this index in a historical graph should therefore be a useful way to show which phase the industrial revolution is in. Changes in the DJIA shares basket, changes in the formula and stock splits during the take-off phase and acceleration phase of industrial revolutions are perfect transition-indicators. The similarities of these indicators during the last two revolutions are fascinating, but also a reason for concern. In fact the graph of the DJIA is a classic example of fictional truth, a hoax.

Transitions

Every production phase, civilization or other human invention goes through a so called transformation process. Transitions are social transformation processes that cover at least one generation. In this article I will use one such transition to demonstrate the position of our present civilization and its possible effect on stock exchange rates.
A transition has the following characteristics:
- It involves a structural change of civilization or a complex subsystem of our civilization
- It shows technological, economical, ecological, socio cultural and institutional changes at different levels that influence and enhance each other
- It is the result of slow changes (changes in supplies) and fast dynamics (flows)
A transition process is not fixed from the start because during the transition processes will adapt to the new situation. A transition is not dogmatic.

Four Transition Phases

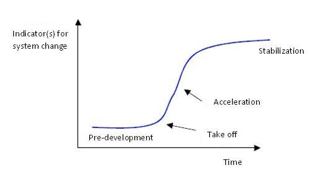
In general transitions can be seen to go through the S curve and we can distinguish four phases.
Figure 1: The four phases in a transition best visualized by means of an S curve: Pre-development, Take-off, Acceleration, Stabilization.
Untitled1
1. A pre development phase of a dynamic balance in which the present status does not visibly change
2. A take off phase in which the process of change starts because of changes in the system
3. An acceleration phase in which visible structural changes take place through an accumulation of socio cultural, economical, ecological and institutional changes influencing each other; in this phase we see collective learning processes, diffusion and processes of embedding
4. A stabilization phase in which the speed of sociological change slows down and a new dynamic balance is achieved through learning
A product life cycle also goes through an S curve. In that case there is a fifth phase:
5. The degeneration phase in which cost rises because of over capacity and the producer will finally withdraw from the market
When we look back into the past we see three transitions, also called industrial revolutions, taking place with far-reaching effect :
1. The first industrial revolution (1780 until circa 1850); the steam engine
2. The second industrial revolution (1870 until circa 1930); electricity, oil and the car
3. The third industrial revolution (1950 until ….); computer and microprocessor

Dow Jones Industrial Average (DJIA)

The Dow Index was first published in 1896 when it consisted of just 12 constituents and was a simple price average index in which the sum total value of the shares of the 12 constituents were simply divided by 12. As such those shares with the highest prices had the greatest influence on the movements of the index as a whole. In 1916 the Dow 12 became the Dow 20 with four companies being removed from the original twelve and twelve new companies being added. In October, 1928 the Dow 20 became the Dow 30 but the calculation of the index was changed to be the sum of the value of the shares of the 30 constituents divided by what is known as the Dow Divisor.
While the inclusion of the Dow Divisor may have seemed totally straightforward it was – and still is – anything but! Why so? Because every time the number of, or specific constituent, companies change in the index any comparison of the new index value with the old index value is impossible to make with any validity whatsoever. It is like comparing the taste of a cocktail of fruits when the number of different fruits and their distinctive flavours – keep changing. Let me explain the aforementioned as it relates to the Dow.
The False Appreciation of the Dow Explained
On the other hand, companies in the take-off or acceleration phase are added to the index. This greatly increases the chances that the index will always continue to advance rather than decline. In fact, the manner in which the Dow index is maintained actually creates a kind of pyramid scheme! All goes well as long as companies are added that are in their take-off or acceleration phase in place of companies in their stabilization or degeneration phase.
On October 1st, 1928, when the Dow was enlarged to 30 constituents, the calculation formula for the index was changed to take into account the fact that the shares of companies in the Index split on occasion. It was determined that, to allow the value of the Index to remain constant, the sum total of the share values of the 30 constituent companies would be divided by 16.67 ( called the Dow Divisor) as opposed to the previous 30.
On October 1st, 1928 the sum value of the shares of the 30 constituents of the Dow 30 was $3,984 which was then divided by 16.67 rather than 30 thereby generating an index value of 239 (3984 divided by 16.67) instead of 132.8 (3984 divided by 30) representing an increase of 80% overnight!! This action had the affect of putting dramatically more importance on the absolute dollar changes of those shares with the greatest price changes. But it didn’t stop there!
On September, 1929 the Dow divisor was adjusted yet again. This time it was reduced even further down to 10.47 as a way of better accounting for the change in the deletion and addition of constituents back in October, 1928 which, in effect, increased the October 1st, 1928 index value to 380.5 from the original 132.8 for a paper increase of 186.5%!!! From September, 1929 onwards (at least for a while) this “adjustment” had the affect – and I repeat myself – of putting even that much more importance on the absolute dollar changes of those shares with the greatest changes.

How the Dow Divisor Contributed to the Crash of ‘29

From the above analyses/explanation it is evident that the dramatic “adjustments” to the Dow Divisor (coupled with the addition/deletion of constituent companies according to which transition phase they were in) were major contributors to the dramatic increase in the Dow from 1920 until October 1929 and the following dramatic decrease in the Dow 30 from then until 1932 notwithstanding the economic conditions of the time as well.

Dow Jones Industrial Index is a Hoax

In many graphs the y-axis is a fixed unit, such as kg, meter, liter or euro. In the graphs showing the stock exchange values, this also seems to be the case because the unit shows a number of points. However, this is far from true! An index point is not a fixed unit in time and does not have any historical significance. An index is calculated on the basis of a set of shares. Every index has its own formula and the formula gives the number of points of the index. Unfortunately many people attach a lot of value to these graphs which are, however, very deceptive.
An index is calculated on the basis of a set of shares. Every index has its own formula and the formula results in the number of points of the index. However, this set of shares changes regularly. For a new period the value is based on a different set of shares. It is very strange that these different sets of shares are represented as the same unit. In less than ten years twelve of the thirty companies (i.e. 40%) in the Dow Jones were replaced. Over a period of sixteen years, twenty companies were replaced, a figure of 67%. This meant that over a very short period we were left comparing a basket of today’s apples with a basket of yesterday’s pears.
Even more disturbing is the fact that with every change in the set of shares used to calculate the number of points, the formula also changes. This is done because the index, which is the result of two different sets of shares at the moment the set is changed, must be the same for both sets at that point in time. The index graphs must be continuous lines. For example, the Dow Jones is calculated by adding the shares and dividing the result by a number. Because of changes in the set of shares and the splitting of shares the divider changes continuously. At the moment the divider is 0.15571590501117 but in 1985 this number was higher than 1. An index point in two periods of time is therefore calculated in different ways:
Dow1985 = (x1 + x2 +..+x30) / 1
Dow2014 = (x1 + x2 +.. + x30) / 0.15571590501117
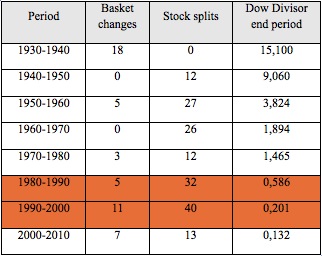
In the 1990s many shares were split. To make sure the result of the calculation remained the same both the number of shares and the divider changed. An increase in share value of 1 dollar of the set of shares in 2014 results is 6.4 times more points than in 1985. The fact that in the 1990s many shares were split is probably the cause of the exponential growth of the Dow Jones index. At the moment the Dow is at 16,437 points. If we used the 1985 formula it would be at 2,559 points.
The most remarkable characteristic is of course the constantly changing set of shares. Generally speaking, the companies that are removed from the set are in a stabilization or degeneration phase. Companies in a take off phase or acceleration phase are added to the set. This greatly increases the chance that the index will rise rather than go down. This is obvious, especially when this is done during the acceleration phase of a transition. From 1980 onward 7 ICT companies (3M, AT&T, Cisco, HP, IBM, Intel, Microsoft), the engines of the latest revolution and 5 financial institutions, which always play an important role in every transition, were added to the Dow Jones.
Table 1. Changes in the Dow, stock splits and the value of the Dow Divisor after the market crash of 1929
Screen shot 2014-05-10 at 1.26.43 AM
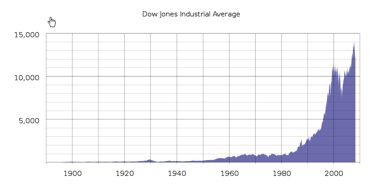
Figure 2. Exchange rates of Dow Jones during the latest two industrial revolutions
Untitled2
During the last few years the rate increases have accelerated enormously.

Overview from 1997 : 20 winners in – 20 losers out, a figure of 67%>

September 23, 2013: Hewlett – Packard Co., Bank of America Inc. and Alcoa Inc. will replaced by Goldman Sachs Group Inc., Nike Inc. and Visa Inc.
Alcoa has dropped from $40 in 2007 to $8.08. Hewlett- Packard Co. has dropped from $50 in 2010 to $22.36.
Bank of America has dropped from $50 in 2007 to $14.48.
But Goldman Sachs Group Inc., Nike Inc. and Visa Inc. have risen 25%, 27% and 18% respectively in 2013.
September 20, 2012: UnitedHealth Group Inc. (UNH) replaces Kraft Foods Inc.
Kraft Foods Inc. was split into two companies and was therefore deemed less representative so no longer suitable for the Dow. The share value of UnitedHealth Group Inc. had risen for two years before inclusion in the Dow by 53%.
June 8, 2009: Cisco and Travelers replaced Citigroup and General Motors.
 Citigroup and General Motors have received billions of dollars of U.S. government money to survive and were not representative of the Dow.
September 22, 2008: Kraft Foods Inc. replaced American International Group. 
American International Group was replaced after the decision of the government to take a 79.9% stake in the insurance giant. AIG was narrowly saved from destruction by an emergency loan from the Fed.
February 19, 2008: Bank of America Corp. and Chevron Corp. replaced Altria Group Inc. and Honeywell International.
Altria was split into two companies and was deemed no longer suitable for the Dow.
 Honeywell was removed from the Dow because the role of industrial companies in the U.S. stock market in the recent years had declined and Honeywell had the smallest sales and profits among the participants in the Dow.
April 8, 2004: Verizon Communications Inc., American International Group Inc. and Pfizer Inc. replace AT & T Corp., Eastman Kodak Co. and International Paper.
AIG shares had increased over 387% in the previous decade and Pfizer had an increase of more than 675& behind it. Shares of AT & T and Kodak, on the other hand, had decreases of more than 40% in the past decade and were therefore removed from the Dow.
November 1, 1999: Microsoft Corporation, Intel Corporation, SBC Communications and Home Depot Incorporated replaced Chevron Corporation, Goodyear Tire & Rubber Company, Union Carbide Corporation and Sears Roebuck.
March 17, 1997: Travelers Group, Hewlett-Packard Company, Johnson & Johnson and Wal-Mart Stores Incorporated replaced Westinghouse Electric Corporation, Texaco Incorporated, Bethlehem Steel Corporation and Woolworth Corporation.

Real truth and Fictional truth

Is the number of points that the Dow Jones now gives us a truth or a fictional truth? 
If a fictional truth then the number of points now says absolutely nothing about the state that the economy or society is in when compared to the past. In that case a better guide would be to look at the number of people in society that use food stamps today – That is the real truth
Print Friendly
Twitter65DiggReddit0StumbleUpon0Facebook23LinkedIn2Google+1bufferEmail

Tuesday, May 6, 2014

America Is Declining at the Same Warp Speed That's Minting Billionaires and Destroying the Middle Class


Home


Not a single U.S. city ranks among the world’s most livable cities


May 5, 2014  |  

“The game is rigged,” writes Senator Elizabeth Warren in her new book A Fighting Chance. It’s rigged because the rich and their lobbyists have rigged the rules of the game to their favor. The rules are reflected in a tax code and bankruptcy laws that have seen the greatest transfer of wealth from the middle class to the rich in U.S. history.
The result?
America has the most billionaires in the world, but not a single U.S. city ranks among the world’s most livable cities. Not a single U.S. airport is among the top 100 airports in the world. Our bridges, road and rail are falling apart, and our middle class is being guttered out thanks to three decades of stagnant wages, while the top 1 percent enjoys 95 percent of all economic gains.
A rigged tax code and a bloated military budget are starving the federal and state governments of the revenue it needs to invest in infrastructure, which means today America looks increasingly like a Third World nation, and now new data shows America’s intellectual resources are also in decline.
For the past three decades, the Republican Party has waged a dangerous assault on the very idea of public education. Tax cuts for the rich have been balanced with spending cuts to education. During the New Deal era of the 1940s to 1970s, public schools were the great leveler of America. They were our great achievement. It was universal education for all, but today it’s education for those fortunate enough to be born into wealthy families or live in wealthy school districts. The right’s strategy of defunding public education leaves parents with the option of sending their kids to a for-profit school or a theological school that teaches kids our ancestors kept dinosaurs as pets.
“What kind of future society the defectors from the public school rolls envision I cannot say. However, having spent some time in the Democratic Republic of Congo—a war-torn hellhole with one of those much coveted limited central governments, and, not coincidentally, a country in which fewer than half the school-age population goes to public school—I can say with certainty that I don’t want to live there,” writes Chuck Thompson in Better off Without Em.
Comparisons with the Democratic Republic of Congo are not that far-fetched given the results of a recent report by Organization for Economic Co-operation and Development(OECD), which is the first comprehensive survey of the skills adults need to work in today’s world, in literacy, numeracy and technology proficiency. The results are terrifying. According to the report, 36 million American adults have low skills.
It gets worse. In two of the three categories tested, numeracy and technological proficiency, young Americans who are on the cusp of entering the workforce—ages 16 to 24—rank dead last, and is third from the bottom in numeracy for 16- to 65-year-olds.
The United States has a wide gap between its best performers and its worst performers. And it had the widest gap in scores between people with rich, educated parents and poor, undereducated parents, which is exactly what Third World countries look like, i.e. a highly educated super class at the top and a highly undereducated underclass at the bottom, with very little in the middle.
The report shows a relationship between inequalities in skills and inequality in income. “How literacy skills are distributed across a population also has significant implications on how economic and social outcomes are distributed within the society. If large proportions of adults have low reading and numeracy skills, introducing and disseminating productivity-improving technologies and work-organization practices can be hampered; that, in turn, will stall improvements in living standards,” write the authors of the report.
There is a defined correlation between literacy, numeracy and technology skills with jobs, rising wages and productivity, good health, and even civic participation and political engagement. Inequality of skills is closely correlated to inequality of income. In short, our education system is not meeting the demands of the new global environment, and the outlook is grim, given the Right’s solution is to further defund public education while ushering kids into private schools and Christian academies aka “segregation academies.”  The Republican-controlled South is where you see the Right’s education strategy in action. “Inspired by home-school superstars such as Creation Museum founder Ken Ham, tens of thousands of other southern families have fled their public-school systems in order to soak their children in the anti-intellectual sitz bath of religious denial.” In other words, we’re dumb and getting dumber.
While charter schools aren’t unique to the South, conservative states tend to respond most enthusiastically to their message, which makes Republican-controlled states ground zero for the further degradation of public education. The U.S. will likely continue to poll like countries like Indonesia and Tanzania, rather than Japan and Sweden when it comes to meeting the demands of a global economy.
Despite their hype and profits, study after study show that kids in charter schools perform no better on achievement tests than kids in public schools. But the correlation between a strong public education system and social mobility is demonstrated clearly in the OECD report. A 2006 report by Michael A. McDaniel of Virginia Commonwealth University showed that states with higher estimated collective IQ have greater gross state product, citizens with better health, more effective state governments, and less violent crime. In other words, were we to invest more in public education, we’d be instantly more intelligent, healthy, safe, and financially sound.
“The principal force for convergence [of wealth] — the diffusion of knowledge — is only partly natural and spontaneous. It also depends in large part on educational policies,” writes Thomas Piketty in his 700-page bestseller Capital in the Twenty-First Century. In other words, if we really want to reduce inequality, and if we really want to be a global leader in the 21st century, we need to invest more into our education system, which requires the federal government to ensure the rich and the mega-corporations pay their share. But we need to act now.
CJ Werleman is the author of "Crucifying America," and "God Hates You. Hate Him Back." Follow h

Wednesday, April 30, 2014

Fast Food Pulls a Fast One: Facts So Horrible Only Republicans Could Enjoy


CommonDreams.org

Fast Food Pulls a Fast One

Patrons enter the Taco Bell fast-food restaurant in Franklin Township, Somerset County, NJ. (AP Photo/Mike Derer)Bad enough that the empty calories of many a fast-food meal have all the nutritional value of a fingernail paring. Even worse, the vast profits this industry pulls in are lining the pockets of its CEOs while many of those who work in the kitchens and behind the counters are struggling to eke out a living and can’t afford a decent meal, much less a fast one.
Yes, you have heard this before. Over the last year or so, you’ve probably seen news coverage of the strikes and other job actions fast-food workers have taken against their employers. Maybe you’ve even read about the wage theft lawsuits that have been filed against McDonald’s and Taco Bell, or the recent settlements in New York State against McDonald’s, Pizza Hut and Domino’s Pizza that have led to payments to employees of more than $2 million.
But, much in the way that Thomas Piketty’s book Capital in the Twenty-First Century lays out the hard data backing up everything we’ve believed about the reality of vast income inequality in America, a trio of new reports confirms with solid statistics what we’ve suspected about the fast-food industry — that those in charge are gobbling up the profits voraciously while their workers are forced into public assistance. What’s more, our tax dollars are subsidizing both the fast-food poor who need the help and the fast-food rich who don’t.
First, a recent data brief from the National Employment Law Project (NELP) notes, “Lower-wage industries accounted for 22 percent of job losses during the recession, but 44 percent of employment growth over the past four years. Today, lower-wage industries employ 1.85 million more workers than at the start of the recession.” In other words, as The New York Times more succinctly put it, “The poor economy has replaced good jobs with bad ones.”
Michael Evangelist, author of the NELP report, told the Times, “Fast food is driving the bulk of the job growth at the low end — the job gains there are absolutely phenomenal. If this is the reality — if these jobs are here to stay and are going to be making up a considerable part of the economy — the question is, how do we make them better?”
A study from the public policy and advocacy group Demos, Fast Food Failure, confirms that, “The fast food industry is… one of the highest growth employers in the nation” but needs to address “imbalanced pay practices in order to mitigate the damaging effects of income inequality.”
The numbers are stunning. According to Demos, “In 2012, the compensation of fast food CEOs was more than 1,200 times the earnings of the average fast food worker. Proxy disclosures recently released by fast food companies reveal that the ratio remained above 1,000-to-1 in 2013.”
The average fast-food CEO made $23.8 million last year, four times what the average was in 2000, while fast-food workers “are the lowest paid in the economy. The average hourly wage of fast-food employees is $9.09, or less than $19,000 per year for a full-time worker, though most fast-food workers do not get full-time hours. Their wages have increased just 0.3 percent in real dollars since 2000.”
That $19,000 is below the “poverty threshold” for someone supporting a family of three, and on average, fast-food workers actually make less than $12,000 because they don’t get called into work for a full forty hours a week. The Demos report also cites numbers from a University of Illinois/University of California-Berkeley analysis that “87 percent of front-line fast food workers do not receive health benefits through their jobs. Since fast food employers do not pay for the critical needs of low-wage workers and their families, public programs foot the bill.
“According to the same study, more than half of front-line fast food employees are enrolled in a public assistance program, at a cost of nearly $7 billion per year.” Those are public assistance programs for which we’re paying and which the fast-food giants count on to keep their profit margin high while not paying employees what they need to care for their families.
Which brings us to the third report, this one from the progressive Institute for Policy Studies (IPS) and titled, Restaurant Industry Pay: Taxpayers’ Double Burden. Double burden because in addition to the money in food stamps, Medicaid and other government assistance impoverished fast-food workers need to survive, taxpayers also are underwriting CEO compensation.
What? The IPS report explains that it’s pulled off by means of “a loophole that allows all U.S. publicly held corporations to deduct unlimited amounts from their income taxes for the cost of executive stock options, certain stock grants, and other forms of so-called ‘performance pay.’ In effect, these companies are exploiting the U.S. tax code to send taxpayers the bill for the huge rewards they’re doling out to their top executives.”
IPS calculated the pay of the CEOs at the 20 largest corporate members of the National Restaurant Association — known as “the other NRA,” the restaurant industry’s multimillion spending lobbyist. Among those 20 are the CEOs of McDonald’s, Chipotle, Starbucks, Dunkin’ Brands and Yum! Brands, which owns Kentucky Fried Chicken, Taco Bell and Pizza Hut. IPS discovered that over the past two decades, these executives “pocketed more than $662 million in fully deductible ‘performance pay,’ lowering their companies’ IRS bills by an estimated $232 million. That would be enough to cover the average cost of food stamps for more than 145,000 households for a year.” In fact, the bigger the executive payoff, the less the fast-food company pays in taxes. Talk about a Happy Meal. You want fries with that?
So going back to that question Michael Evangelist, author of the NELP report, asks — how can we make things better? For one, as IPS recommends, we can close the performance pay loophole. The Stop Subsidizing Multimillion Dollar Corporate Bonuses Act in Congress caps deductibility of employee compensation at $1 million, period. This could generate $50 billion in revenues over ten years, according to the House and Senate Joint Committee on Taxation. And California Congresswoman Barbara Lee has introduced the Income Equity Act. It cuts off corporate tax deductions for any executive’s pay that’s more than 25 times the salary of the company’s lowest paid worker or $500,000, whichever is highest.
If you think that’s unprecedented, IPS points out that both the Affordable Care Act and the TARP bank bailout sets a $500,000 deductibility cap “on pay for bailout recipients and health insurance firms. The deductibility caps on health insurance firms, designed to discourage these corporations from using profits from premiums to overcompensate their executives, go into effect this year.”
Second, of course, raise the minimum wage, preferably to $15 an hour. As per the IPS report, “Minimum wage increase supporters highlight the potential stimulus effects of putting more money into the pockets of low-wage earners. Unlike those at the top end of the income scale, minimum wage workers tend to spend all of their earnings” — just to meet basic needs. “Every extra dollar that goes to a low-wage worker adds about $1.21 to the national economy. This economic stimulus would pump money into local economies and help create new jobs.”
Ultimately, though, it’s the companies that must take action. Yet some of their CEOs say they favor a wage hike but still allow the National Restaurant Association to continue doing their dirty work for them, lobbying fiercely, as they are right now in Congress against any minimum wage hike at all (this is the same gang that for more than twenty years has kept the minimum wage for tipped restaurant workers at a paltry $2.13 an hour).
Time for the CEOs to put their money where it counts, “to arrest the damage,” as that Demos report says, “from pay disparity and restore the focus on long-term interests of the firm.” Time to show some foresight, for as wages remain stagnant, purchases will go unmade, the health and wellbeing of workers will continue to decline and with that deterioration, the service and reliability on which the companies ultimately depend for profitability will crash as well.
If things continue as they are, the only thing fast about the fast-food business will be the speed of its fall.

Saturday, April 26, 2014

The New Gilded Age: A bigger con job than the first one

SALON


The New Gilded Age: A bigger con job than the first one


Inequality has reached 19th-century levels – but that era had a dynamism and optimism that ours can only fake


The New Gilded Age: A bigger con job than the first oneDonald Trump (Credit: AP/Mary Altaffer/Reuters/Steve Marcus)

Every time we travel by air, we encounter vivid evidence of what Robert Reich and various others have recently described as the New Gilded Age. The airlines and the supposedly neutral bureaucrats of the TSA don’t even pretend that our society is not divided into economic castes. Coach passengers wait in hour-long security lines and are herded aboard the aircraft in numerically coded clusters, to be ensconced in a tiny, cramped seat and begrudgingly offered a four-ounce cup of Sprite. It’s like a stern reminder that our presence is being suffered rather than encouraged, that our Orbitz or Kayak discount tickets are not what’s keeping this failing industry afloat.
Those traveling first class or business, in many contexts, have their own departure lounges, their own lines (very short ones) and their own entrances to the plane. They are whisked aboard ahead of the rest of us, and disappear into an apartheid realm of luxury that is both metaphorical and real. As a fascinating and, to my mind, terrifying New Yorker article by David Owen recently explained, vast resources and immense levels of design, engineering and architectural skill have been devoted to creating these mile-high fantasylands of privilege: Enclosed cabins with double beds, mini-home-theater systems, gourmet meals curated by a chef and sommelier, and so on.
Now, the fact that all this airborne decadence is something of a Potemkin village – you’re still aboard an airplane, in a space smaller than a $39 single at the Motel 6 behind the Conoco station – and that most of the passengers in first class or business are mid-level corporate suits rather than genuine tycoons, tells us something important about the New Gilded Age. It’s pretty much a fake. It’s like a giant game of three-card monte, in which the superrich move just enough money around to make society appear dynamic, to convince many of the rest of us that lives of wealth and luxury await us, just beyond the horizon. The first-class cabin, like the McMansions Thomas Frank recently wrote about, is a vulgar echo of something that once seemed impressive, a promise that is never fulfilled. It’s a reminder that in America we are never to see ourselves as members of an exploited class, but only, in the apocryphal but revealing phrase attributed to John Steinbeck, as temporarily embarrassed millionaires. (What Steinbeck actually wrote has a quite different flavor and meaning.)
Frank’s economic, social and aesthetic history of the big-ass ugly house was great fun to read, but I think he makes a taxonomical error, or at least an oversimplification. The McMansion, at least in its classic mass-produced form – known to real-estate agents as the “five-minute house,” or in the British Isles as the “fuck-me house,” for the exclamation it provokes — is only the true abode of the bottom half of the 1 percent, people earning roughly $350,000 to $500,000, most of whom go to work every day at salaried jobs. The serious hoarders of capital, the top one-third of 1 percent or so, are a tiny and insulated group who wouldn’t be caught dead in some treeless gated community in the Dallas-Fort Worth exurbs. Their enormous, architect-designed or exquisitely renovated digs in East Hampton and Coral Gables and Jackson Hole and the Provençal countryside are grotesque in a different way and on a grander scale. The suburban McMansion is a pale mockery of that kind of wealth, a simulacrum built of stapled-together sheetrock and extended to the next 2 or 3 percent, the lackeys and maidservants of wealth, with all the sincerity of Lucy holding that football for Charlie Brown. It’s the Monopoly money of real estate.
When I say that the New Gilded Age is a fake, I am not claiming that the worsening economic inequality that Reich and Paul Krugman and others write about so eloquently is not real or does not matter. French economist Thomas Piketty has thrown the ultra-rich and their loyal defenders among the right-wing intelligentsia into a panic with his much-discussed bestseller “Capital in the Twenty-first Century,” which argues in intense, data-rich detail that over the past half-century wealth has stagnated and income gone flat for the vast majority of people in the Western world. Furthermore, Piketty draws an explicit comparison with the first Gilded Age of the late 19th century when he observes that those at the top of the wealth pyramid today generally did not get there on merit, because they worked harder and got better educations and developed brilliant ideas, but because they were born atop big piles of money that got bigger, and because current economic conditions exaggerate the inherent tendency of capital to breed and multiply.
Earlier this week, Krugman and David Brooks both took on the Piketty craze in the same issue of the New York Times, and you get one guess as to which of them was skeptical about Piketty’s proposal for a global wealth tax. (It pains me immensely to say this, but Brooks is probably right when he describes that idea as “utopian.”) At least Brooks appears to have skimmed through Piketty’s book; Megan McArdle of Bloomberg wrote a disastrous post in which she sought to debunk his focus on inequality – meaningful friendships and a good marriage are more important! – while admitting that she hadn’t read the book and wasn’t likely to anytime soon.
I don’t know whether this was some editor’s idea of a joke, but on the same day that Brooks’ and Krugman’s columns were published, and just a day after a front-page story about the American middle class falling behind its cognates in Western Europe and Canada, the Times ran a real estate feature entitled “What You Get for … $2,500,000.” This is not something those of us in the lower 99 percent have much cause to wonder about, but even as pornography the article was unsatisfying: a two-bedroom contemporary in the San Juan Islands of Washington state; a three-bedroom cottage on Narragansett Bay in Rhode Island. Pretty houses in picturesque locations and all, but seriously? Two and a half million clams, and your mother-in-law ends up on the sofa? It felt more like a taunt than a promise: If you happen to come into a quite impressive amount of money, which you probably won’t, you still won’t be able to afford anything close to the Architectural Digest houses that seriously rich people own.
When I say that the New Gilded Age is a fake, I mean that it’s even more of a fake than the first one was. It’s a forgery of a forgery of prosperity. Mark Twain and Charles Dudley Warner came up with the phrase in 1873 to indicate that the economic boom of America’s Industrial Age was covering up severe poverty and widespread social problems. They were right, of course: That boom was built largely on exploited low-wage laborers, especially Italian, Jewish and Polish immigrants packed into urban tenement neighborhoods. Politics of the period were infamously corrupt — although political participation was extremely high, with some national elections attracting a 90-percent turnout. (It was both a cynical age and an enthusiastic one.) African-Americans in the South were an oppressed and terrorized serf class with no political rights; women could not vote (except in a few Western states) and generally could not earn money or own property independent of their husbands.
But with all that said, the Gilded Age boom actually was a boom, albeit an uneven and highly stratified one. Real wages rose by 60 percent between 1860 and 1890, even with a steady incoming tide of immigration, and by the turn of the 20th century, per-capita income in the U.S. was much higher than in any European country. Railroads, coal mining, steel production and electricity combined to drive economic growth so dramatic that the 20th century could never quite repeat it, except briefly (and deceptively, Piketty argues) in the aftermath of World War II. Enormous fortunes were accumulated by the likes of John D. Rockefeller, Andrew Carnegie and Cornelius Vanderbilt, but as Piketty knows well, the problem of capital congealing and multiplying among a few families at the top of the heap was much more severe in old-money aristocratic Europe.
In other words, for all its abundant flaws the Gilded Age was a period of immense ferment, dynamism and optimism in America, and I can’t imagine anybody, now or in the future, describing our current age that way. That period witnessed the birth and burgeoning of the labor movement and the women’s movement. Public education became widespread for the first time, cities opened the first public hospitals and states founded the great land-grant universities, most of which were meant to be tuition-free forever. Carnegie, who had risen from poverty in Scotland, gave away nearly his entire fortune, endowing libraries, schools and other public institutions all over the country. Even the more prudent Rockefeller gave away $500 million, about half his total wealth. American art and literature blossomed: It was the era of Whitman and Melville, Edith Wharton and Henry James, Mary Cassatt and Winslow Homer.
The gingerbread mansions of the first-wave Gilded Age aristocrats are undeniably vulgar in their way, oversized imitations of European palazzos visited on the Grand Tour, furnished with looted antiquities, black-market Old Masters and the carcasses of endangered species. But they were also built to last, and every middle-sized American city still has a few of them, preserved as museums or municipal showpieces. They stand as bewildering memorials to a blend of avarice, pretension and public-spiritedness that no longer computes in the post-Reagan era, when fringe free-market ideology has become mainstream and any conception of the “good of society” is communistic. Almost our only engine of economic growth, in the new Gilded Age, is that everything is made to be torn down or thrown away. Does anyone think that the prefab glitz of Trump Tower, which looked crappy a month after it was opened, or Derek Jeter’s 30,000-square-foot “English Manor-style” fuck-me house on Tampa Bay, will be around for our grandkids to gawk at? Would you want them to be?
There are unquestionably things to prefer about our own era: Women, people of color and LGBT folk participate more or less fully in our cultural and political life, and the discourse of rights has evolved in directions few 19th-century Americans could have imagined. (Pot is almost legal now — but opium and cocaine were legal then!) But in economic terms, the first Gilded Age was a period of production and expansion (perhaps unsustainably so), whereas the New Gilded Age is its negative image, a period of contraction and consumption. Instead of Andrew Carnegie founding libraries, we have Donald Trump yelling at people on television like a low-rent parody of the Calvinist God. Instead of rising wages for almost everyone and universal free education, we offer ever cheaper goods made in countries we used to bomb, a mortgage you can’t afford on a house you don’t want in the middle of a former soybean field, and the prospect that one day you’ll get to sit on an airplane in a temporary bubble of pretend wealth – on your boss’s dime! — drinking Champagne and listening to tinny string-quartet music while the rest of us curse at our kids and cram our oddly shaped packages under the seat.